Time series of SST based ONI and Chl-a anomaly depicting the current status of ENSO.
El Niño 2015
La Niña 2010
More Details
Metadata (NSDI 2.0)
#
Attribute
Details
1
Abstract
El Niño Southern Oscillation (ENSO), a global climate phenomenon, occurs in the tropical Pacific Ocean with an anomalous warming phase (El Niño) and a cooling phase (La Niña). It affects global climate and weather system at large scale and cause drought, flood, and forest fire events etc. A substantial decline of Niño3.4 region’s (equatorial central Pacific) chlorophyll-a concentration (Chl-a) is an intrinsic characteristic during the El Niño onset period, which has been considered as a proxy to identify the onset of El Niño and vice-versa for La Niña. While the usual Sea Surface Temperature (SST) based Oceanic Niño Index (ONI) has one and half month phase lag with respect to onset of El Niño. Whereas, Chl-a exhibits an instantaneous sensitivity to the El Niño onset as a response to the weakening of the central pacific upwelling.
2
Keywords
El Niño Southern Oscillation (ENSO), warming phase (El Niño), cooling phase (La Niña), Niño3.4 region’s (equatorial central Pacific), chlorophyll-a concentration (Chl-a)
3
Language
English
4
StartDate
January 2025
5
StopDate
Last month
6
Geographic Extent
135°E - 75°W; 20°S - 20°N
7
Units
mg m⁻³
8
Category
Climate
9
Spatial Resolution
4Km x 4Km
10
Data Valid
Valid only for Equatorial central pacific (135°E - 75°W; 20°S - 20°N)
11
File Format (Image)
PNG
12
File Format (Data)
NetCDF
13
Theme
Current ENSO Status
14
Contact Address
Deputy Director Earth & Climate Sciences Area (ECSA) National Remote Sensing Centre, ISRO Balanagar Hyderabad 500037
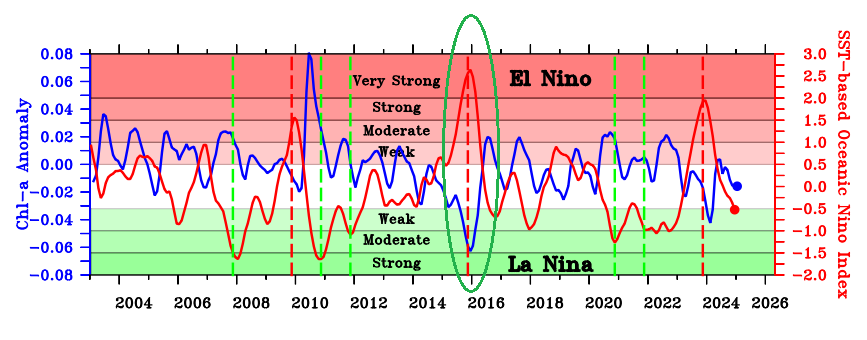
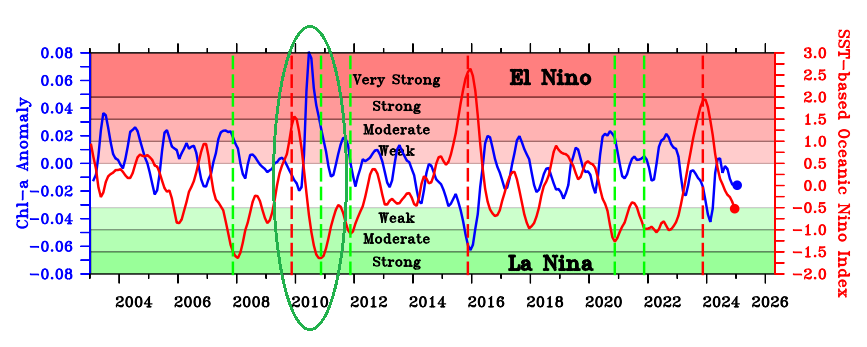
Using satellite-measured Chl-a from MODIS Aqua for the period 2003–2023 in relation to the SST-based ONI, we have demonstrated that a marked decline of spring bloom Chl-a can be a better predictor as compared to ONI. Accordingly, satellite-derived Chl-a during 2003-2023 is used to generate monthly climatology and corresponding monthly time series anomalies are derived and analysed to identify the ENSO events. This study revealed that Chl-a exhibits a significant inverse relationship with ONI during past El Niño events such as 2004-2005, 2006-2007, 2015-2016, 2019-2020 & 2023-2024. Among these five El Niño cases, there are three cases (2006-2007, 2009-2010 and 2015-2016) where ONI and Chl-a exhibits concurrent variability and during the remaining two cases (2004-2005 & 2023-2024) Chl-a exhibits lead signature by around one and half month compared to ONI. Whereas, during the three La Niña cases (2007–2008, 2011–2012, and 2017–2018) two events (2007-2008 & 2017-2018) exhibit enhanced Chl-a around one month prior to the decline of ONI and one concurrent case during 2011-2012.
Case Study - 1: Strong El Niño Event during the year 2015
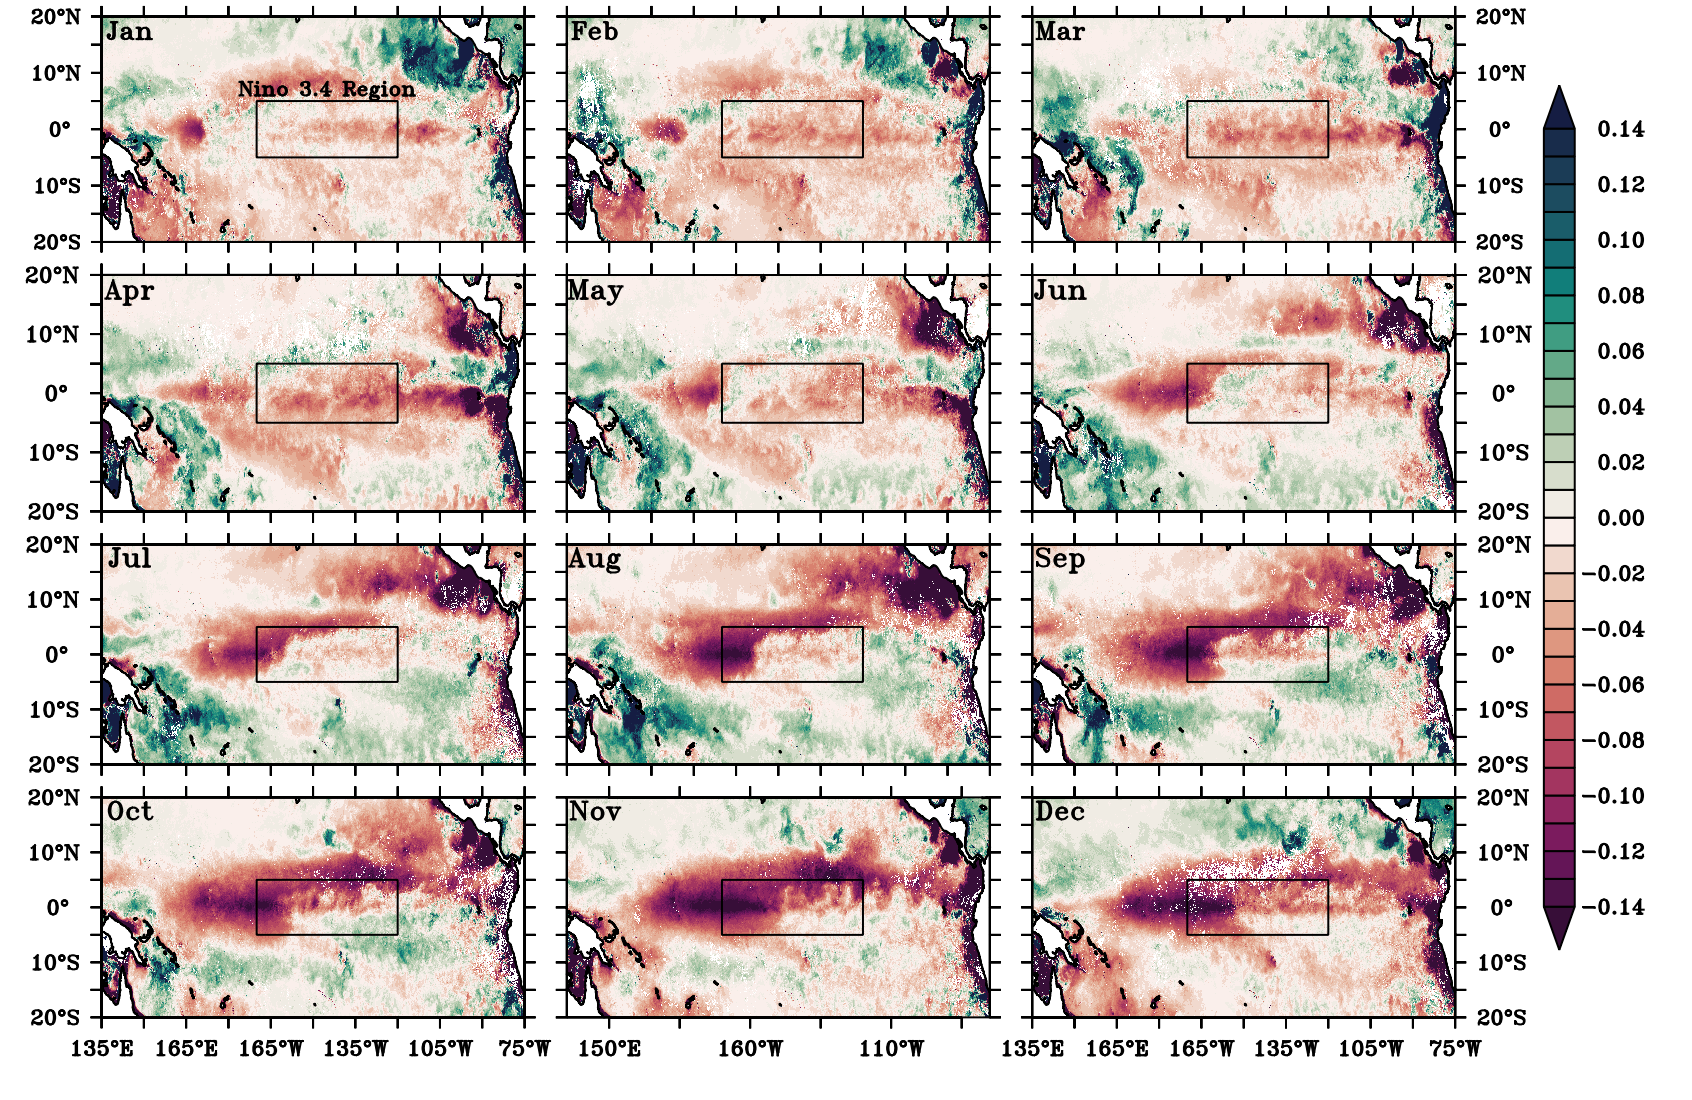
This case study for the year 2015 clearly depicts the monthly evolution of strong negative Chl-a anomalies observed in the central Pacific Ocean indicating the suppression of typical equatorial upwelling during an El Niño year.
Fig. Monthly spatial distribution of Chl-a anomaly in the tropical Pacific Ocean during 2015 El Niño year.
Fig. Time series of SST based ONI and Chl-a anomaly depicting strong El Niño induced signature during 2015. Vertical dashed red lines indicate other El Niño years during 2009 & 2023.
Case Study - 2: Strong La Niña Event during the year 2010
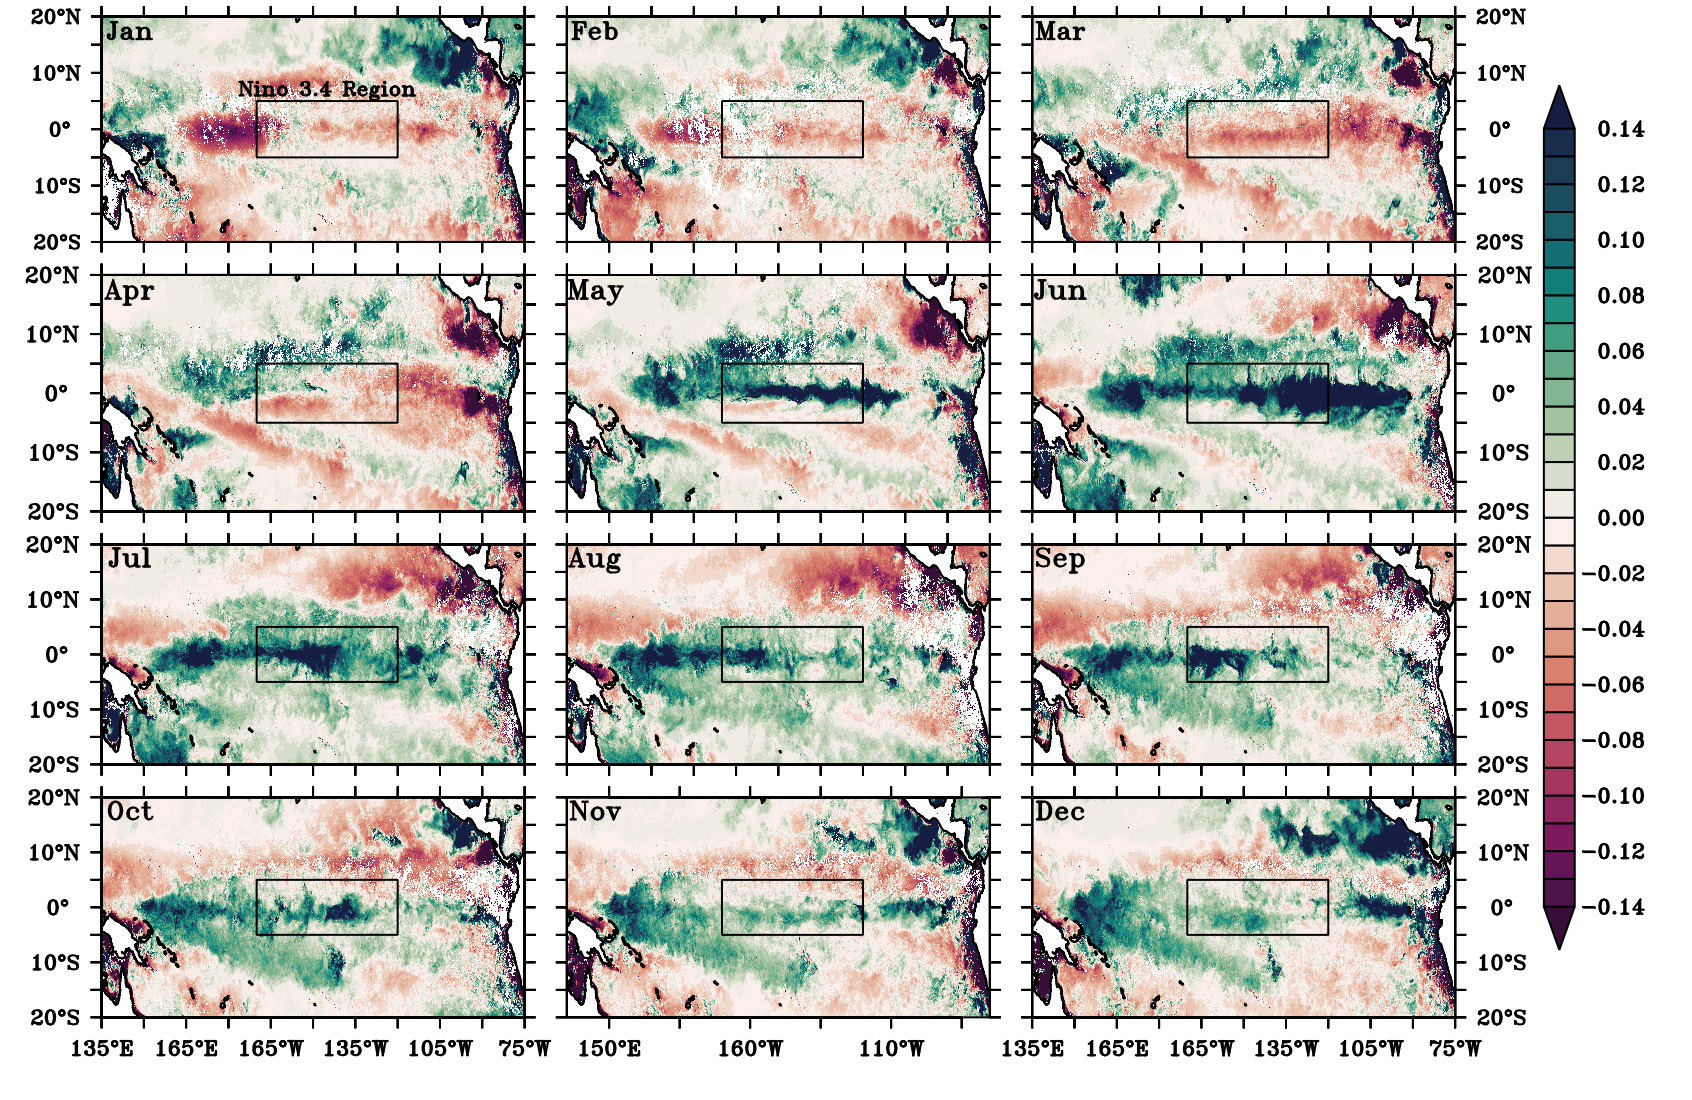
This case study for the year 2010 clearly depicts the monthly evolution of strong positive Chl-a anomalies observed in the central Pacific Ocean indicating the strengthening of typical equatorial upwelling during a La Niña year.
Fig. Monthly spatial distribution of Chl-a anomaly in the tropical Pacific Ocean during 2010 La Niña year.
Fig. Time series of Chl-a anomaly and SST based ONI depicting strong La Niña induced signature during 2010. Vertical dashed green lines indicate other La Niña years during 2007, 2011, 2020 & 2021.
Reference(s):
Manche, S. S., Swapna, M., Mishra, S. K., Rajesh, S., Nayak, R. K., Ramana, M. V., Bothale, R. V., & Chauhan, P. (2024). An anomalous decline of the spring bloom chlorophyll concentration in the central Pacific is an early indicator of El Niño. Journal of the Indian Society of Remote Sensing, 52(5), 973–989.
https://doi.org/10.1007/s12524-024-01848-8