









Long-term monitoring of near-surface CO2 at Shadnagar, India, provides valuable insights into changes in atmospheric composition and the regional carbon cycle. Observations from July 2013 to August 2026 show a clear and statistically significant increasing trend of 2.56 ± 0.27 ppm yr⁻¹, with an overall mean concentration of 414.42 ± 15.96 ppm. The record also reveals a pronounced seasonal cycle, with CO2 concentrations generally highest during April–May and lowest during July–September. These variations reflect the combined influence of vegetation uptake, respiration, atmospheric transport, and regional emission sources. The long-term dataset provides an important reference for carbon-cycle studies, satellite validation, atmospheric modelling, and climate assessment, supporting informed climate action and SDG 13. Read More..




Collaborations

Extreme Rainfall Prediction and CO2 Source-Sink Assessment
NRSC-ISRO & IISc Collaboration on Extreme Rainfall Prediction and CO2 Source-Sink Assessment
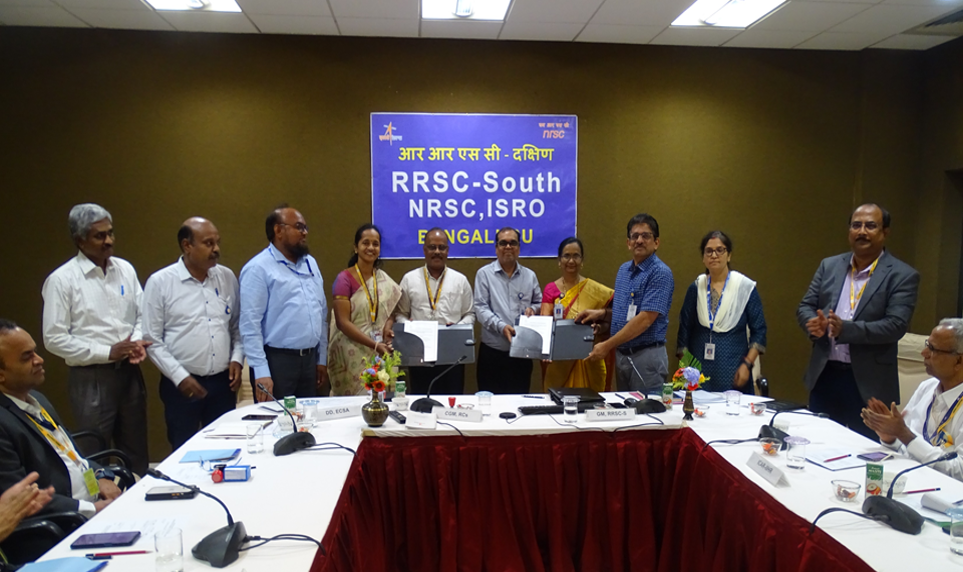
Estimation of CO2 fluxes in the shaded coffee ecosystem region of Karnataka
Collaboration with Central Coffee Research Institute for the Carbon Flux Studies with Eddy Covariance in the shaded coffee ecosystem region of Karnataka
Monitoring and assessment of Air Pollution (MAAP) using IOT sensors
A prototype solution to monitor the air quality on CO, PM2.5 and PM10 using cost effective IoT sensors is developed and demonstrated at “Smart City Hackathon 2018"
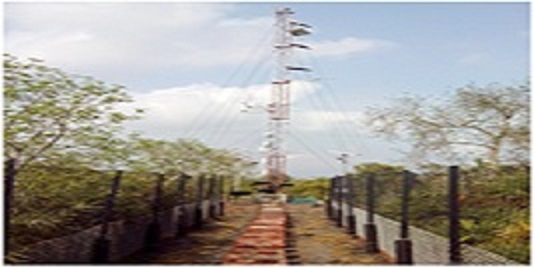
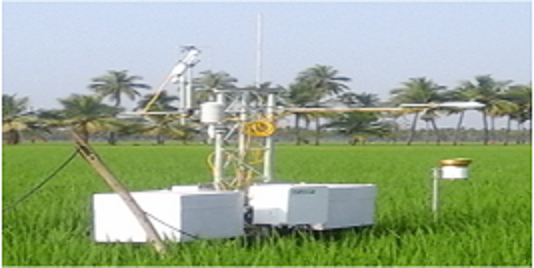
Continuous CO2 flux information to study the carbon net-energy in the temperate ecosystem is being generated using an eddy covariance flux tower.
Publications
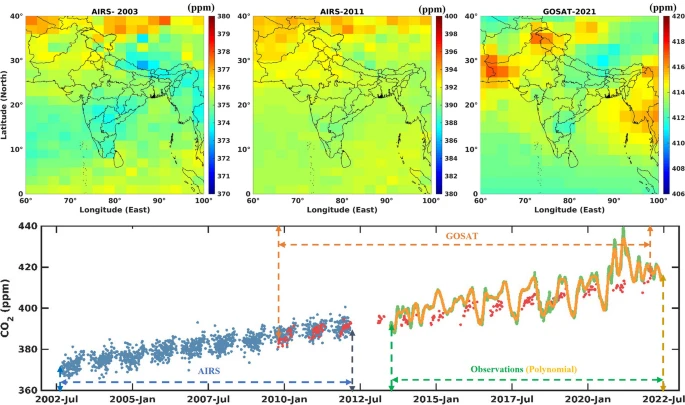
Unravelling the Interannual Changes in the Decade Observations of GHGs as Climate Indicators
Interannual variations of CO2 and CH4 for a decade between the years 2013 and 2022 over the suburban city of Shadnagar, near Hyderabad, India is reported here. Know More..
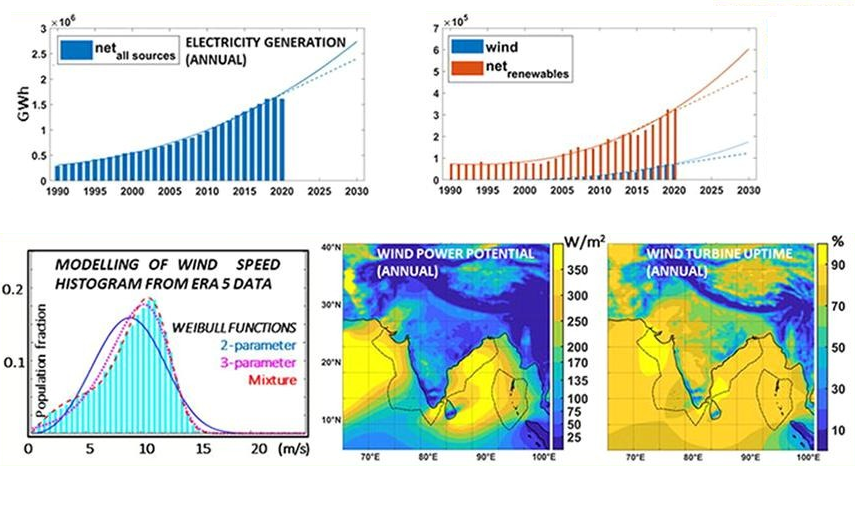
Wind power potential over India using ERA5 reanalysis
In this study, we estimate wind power potential at 100 m level over the Indian domain using data from the ERA5 reanalysis for 1979–2018 through the Weibull mixture distribution. Visit
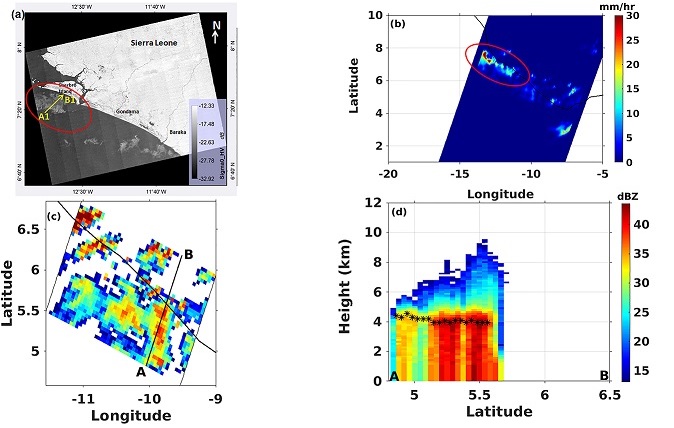
Deciphering the Signatures of Oceanic Convective Rain Cells
In this paper, we have used C-band SAR images and near-simultaneous observations from the global precipitation measurements (GPM) to study the signatures of multiple convective rain cells. Read More..